How Much Does Beer Brewing Equipment Capacity Matter?
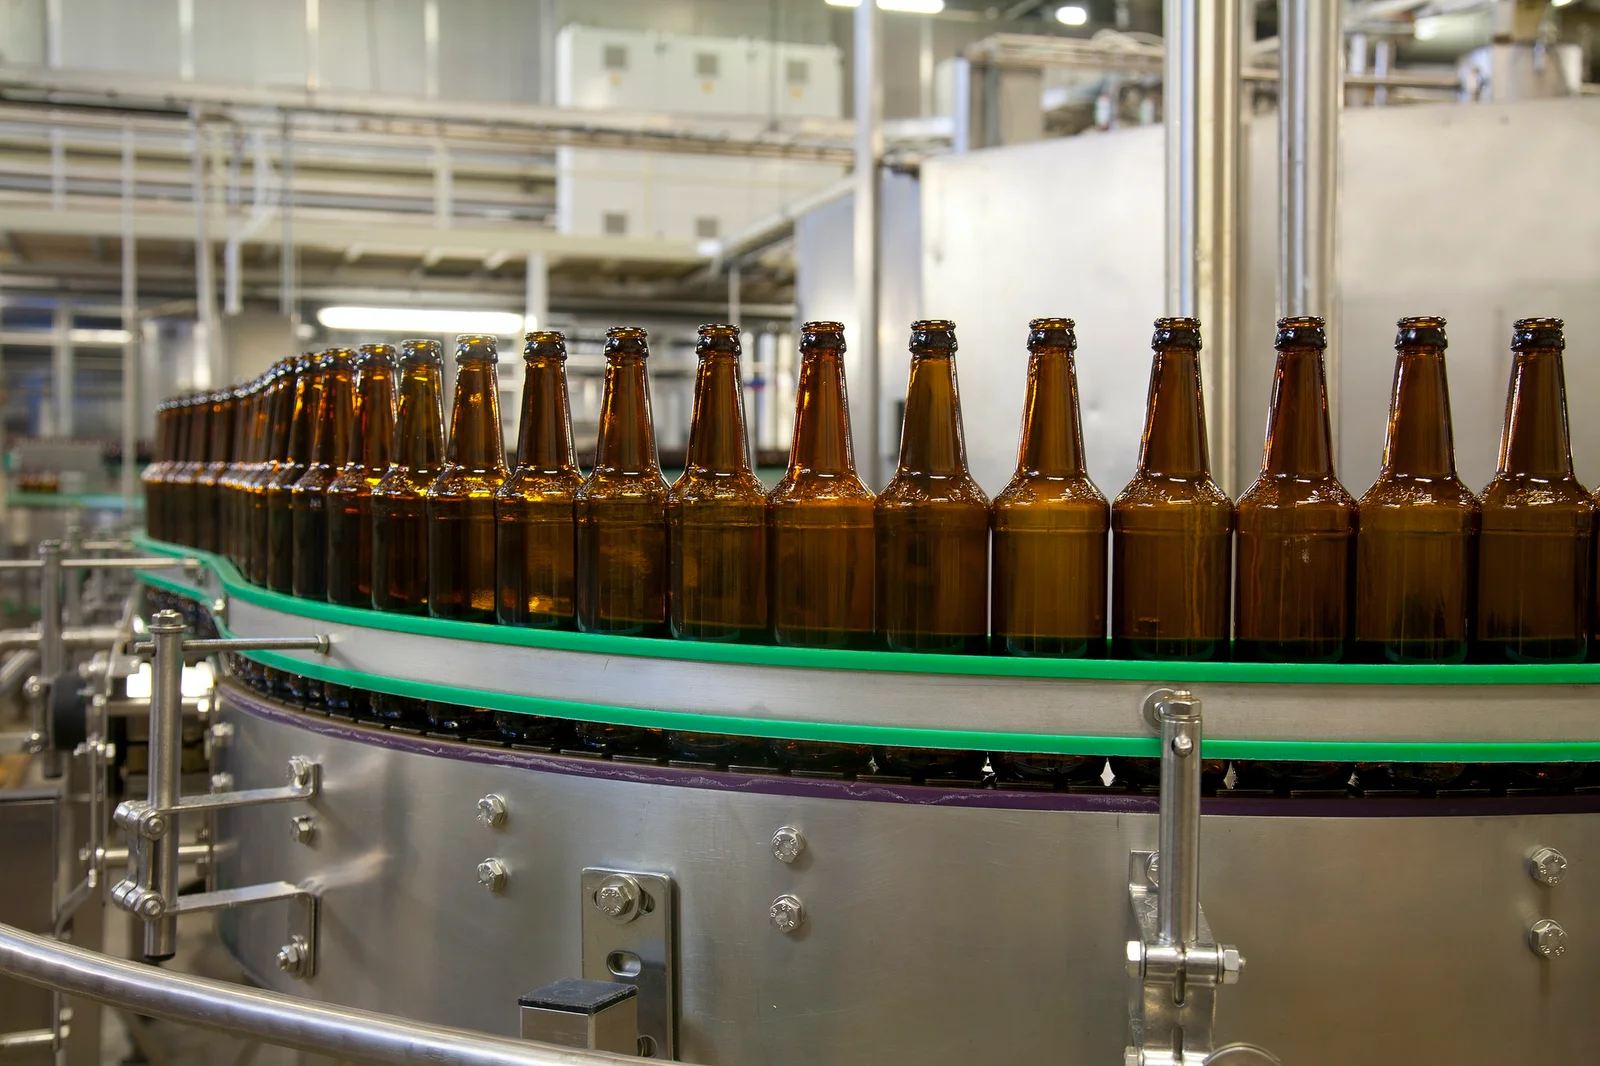
Beer brewing equipment capacity affects annual output, labor hours, utility use, tank turnover, and expansion cost. A 10 BBL brewhouse can produce far more than 10 BBL per week when operated for multiple turns, while a 20 BBL system may produce less than expected when fermentation tanks remain occupied for 18–21 days. Breweries also lose volume during transfer, yeast removal, dry hopping, filtration, and packaging. A planning model that assumes 100% vessel yield will overstate saleable beer. In practice, brewhouse size works only when fermentation, cooling, packaging, labor, and demand are sized around it.
A 20 BBL brewhouse with 12 suitable fermenters can support a very different annual output from a 20 BBL brewhouse with four tanks.
The first number to establish is annual sales volume. A brewery planning to sell 3,000 BBL in 2027 does not need equipment for 10,000 BBL simply because larger vessels reduce the number of brewing cycles. It needs enough capacity to produce around 3,000 BBL after normal losses, plus room for seasonal demand and maintenance. If packaged yield averages 92% of brewhouse volume, 3,000 BBL of finished beer requires about 3,261 BBL of brewed volume before additional packaging losses.
That yield assumption changes the equipment calculation quickly. At 10 BBL per batch, 3,261 BBL requires roughly 327 brewhouse batches. At 20 BBL, the same production plan needs about 163 batches. At 30 BBL, it drops to approximately 109 batches. Fewer batches can reduce cleaning cycles, heating events, transfer work, and operator hours, but only when the brewery has enough cellar space to receive the wort.
Cutting annual brew days by 40% does not help if fermenters are already full.
That relationship becomes clearer when fermentation time is added. Suppose a 10 BBL fermenter holds beer for 18 days on average. One vessel can support about 20 cycles in a 365-day year under an idealized schedule, before cleaning, maintenance, scheduling gaps, and seasonal changes are included. Ten such tanks therefore represent roughly 200 nominal tank cycles per year.
If average residence time falls from 18 days to 14 days, theoretical cycle capacity rises by about 29%. If it increases from 18 to 24 days, theoretical cycle capacity falls by about 25%. Lager-heavy production can therefore require much more cellar volume than a taproom focused on fast-turning ales, even when both businesses sell similar annual volumes.
Tank size also affects product planning. A brewery with twelve 20 BBL fermenters has 240 BBL of nominal fermentation volume, but that does not mean 240 BBL of every product can be made at once. A 5 BBL seasonal beer placed in a 20 BBL vessel may leave 75% of the vessel unused unless the process allows a different filling method. A brewery carrying 15 active brands may therefore prefer mixed vessel sizes rather than one uniform tank size.
Capacity is measured in liters or barrels, but scheduling efficiency depends on how those liters or barrels are divided across tanks.
The brewhouse-to-fermenter ratio deserves its own calculation. Suppose a brewery runs a 15 BBL brewhouse with two turns per brewing day. That creates 30 BBL of wort per day. If the brewery operates four brewing days per week for 48 weeks, theoretical brewhouse output reaches 5,760 BBL per year. At a 92% average packaged yield, the same schedule could correspond to about 5,299 BBL of packaged beer.
That number still depends on downstream capacity. If fermentation volume supports only 3,500 BBL per year, the brewhouse cannot raise finished production to 5,299 BBL simply by adding more brew days. Likewise, if the packaging line can process only 300 BBL per month, a large cellar may create inventory faster than finished beer can leave the brewery.
The same constraint appears with utilities. A larger brewhouse can require greater steam production, electrical capacity, water flow, drainage, and cooling capacity. If a brewery upgrades from 10 BBL to 30 BBL, the vessel volume increases by 200%, but utility requirements do not always increase in exactly the same proportion. Equipment design, heating method, insulation, brew length, local code, and operating schedule all affect the final specification.
For example, a brewhouse operating two 20 BBL turns per day places a different demand on a steam system from a brewery producing one 40 BBL batch every other day. The annual output could be similar while the hourly utility demand differs substantially. Utility planning therefore needs both daily volume and peak operating load rather than one annual barrel figure.
Packaging adds another layer. A brewery may have 500 BBL of finished beer available but only a 10 BBL-per-hour canning line. At that rate, 500 BBL represents about 50 hours of packaging time before changeovers, sanitation, quality checks, keg filling, labeling, and maintenance are included.
A smaller packaging line can therefore limit the value of larger fermenters. In a brewery packaging 70% of its beer in cans and bottles, packaging speed becomes more important as annual volume rises. In a taproom where 80% of sales happen directly from draft, the same packaging limitation may have a smaller effect on the production plan.
The production system should be sized around the slowest practical step, not the largest vessel.
Space planning matters for the same reason. Fermenters require room for doors, fittings, cleaning access, piping, service work, and safe movement of staff. A 30 BBL tank may occupy much more usable floor area than its vessel diameter alone suggests because surrounding access must remain clear.
Future expansion should also be considered before equipment is installed. A brewery producing 2,000 BBL in 2027 may reach 4,000 BBL by 2029. Installing only the equipment needed for 2,000 BBL can reduce the initial purchase price, but expansion may later require pipe changes, electrical work, glycol upgrades, drainage modifications, or production downtime. Designing utility routes with additional tank connections can reduce that work.
The financial impact becomes easier to compare through cost per finished barrel. Suppose a small system requires $40 of direct labor and utilities per finished BBL while a larger system reduces that amount to $28. At 5,000 BBL per year, the operating difference is $60,000 annually. If the larger system costs $300,000 more to purchase and install, the extra capital would take about five years to match that operating difference, before financing, maintenance, taxes, and other costs are considered.
That calculation also shows why larger equipment does not automatically produce lower costs. If the brewery sells only 2,000 BBL, the same $12-per-BBL saving generates about $24,000 per year. The additional equipment may then take much longer to justify its cost, especially when utilization remains below 50%.
Equipment selection should also reflect beer style and recipe. A brewery producing heavily dry-hopped IPA may experience larger trub and hop losses than one producing a simple lager. A 10 BBL nominal batch may not generate 10 BBL of packaged beer. If process yield falls from 92% to 86%, finished output from 500 BBL of brewed volume falls from 460 BBL to 430 BBL, a difference of 30 BBL.
Those losses affect tank planning as well. If a brewery sells 100 BBL of a beer each month, but the product loses 8% through production and packaging, it must brew about 109 BBL to supply the sales target. Over 12 months, that additional requirement becomes roughly 108 BBL of extra brewed volume.
For breweries comparing suppliers, equipment configuration matters as much as stated vessel capacity. Specifications should cover working volume, total volume, heating method, insulation, glycol connections, temperature control, pressure rating, cleaning method, pump sizing, valves, electrical requirements, and utility consumption. A supplier such as hgmc beer equipment can be evaluated using the same production assumptions applied to other equipment vendors.
A practical capacity plan can be built around a simple set of operating numbers:
| Planning item | Example |
|---|---|
| Annual packaged volume | 3,000 BBL |
| Average packaged yield | 92% |
| Brew volume required | 3,261 BBL |
| Brewhouse size | 10 BBL |
| Approximate batches/year | 327 |
| Brewing weeks | 48 |
| Average batches/week | 6.8 |
| Fermentation time | 18 days |
| Target utilization | 70–85% |
Using 70–85% planned utilization leaves room for cleaning, maintenance, seasonal changes, and scheduling variation. Running at 100% theoretical capacity all year leaves no practical time for unexpected downtime.
The right equipment capacity therefore depends on several numbers moving together: annual sales, peak demand, packaged yield, brew length, brewhouse turns, fermentation time, tank mix, packaging speed, utility capacity, floor space, and expected growth. A brewery targeting 3,000 BBL in 2027 may need a very different equipment package from one targeting 8,000 BBL in the same year, even when both operate in the same market.
For most breweries, the useful question is not whether a 10, 20, or 30 BBL brewhouse is generally better. The useful comparison is how each configuration performs against the brewery's expected volume, schedule, tank residence time, labor hours, utility demand, and expansion plan. A capacity number becomes useful only after those operating conditions are attached to it.